

Quick Answer
An Excel PivotTable summarizes a structured data range so you can compare totals, counts, averages, patterns, and trends without rewriting formulas for every question. Select a clean table, choose Insert > PivotTable, then place fields into Rows, Columns, Values, and Filters.
TLDR
- Use one header row and consistent values in every source-data column.
- Create the PivotTable from the full table or range.
- Move category fields to Rows and numeric fields to Values.
- Refresh the PivotTable after the source data changes.
- Check whether Excel summarized a numeric field as Sum or Count.
What an Excel PivotTable is useful for
PivotTables help teams summarize sales, workload, expenses, campaign results, inventory, and operational trackers. They are best used when the source data has repeated categories and you need to examine the same dataset from several perspectives.
A pivot table quickly summarizes contiguous data from a table, that you can tweak and ‘pivot’ to show you different aspects of the summary. To demonstrate its usefulness, here’s a simple example table:
| Sales Person | Units Sold | Date |
| Richard | 17 | 01-23-2022 |
| Jenny | 15 | 01-16-2022 |
| Marilyn | 23 | 03-08-2022 |
| Anna | 13 | 02-01-2022 |
| Richard | 10 | 04-05-2022 |
| Anna | 19 | 01-16-2022 |
| Marilyn | 11 | 04-09-2022 |
| Jenny | 8 | 02-01-2022 |
With trackers and reports starting to pile up, you’d likely be behind in your deliverables if you aren’t as excel savvy!
By using a pivot table to quickly summarize the table above, you can answer questions like:
- Who has the most sales in the entire period
- Who has the least sales in the entire period
- What date had the most sales
To create the pivot table to answer these questions, follow the steps below (for Office 365):
1. Highlight the entire table
2. Go to the Insert tab, then click PivotTable > From Table/Range
3. In the PivotTable Fields section, drag ‘Sales Person’ and ‘Units Sold’ respectively into Rows
4. Drag ‘Date’ into Columns
5. Finally, drag ‘Units Sold’ into Values.
You should get a Pivot table that looks like this:
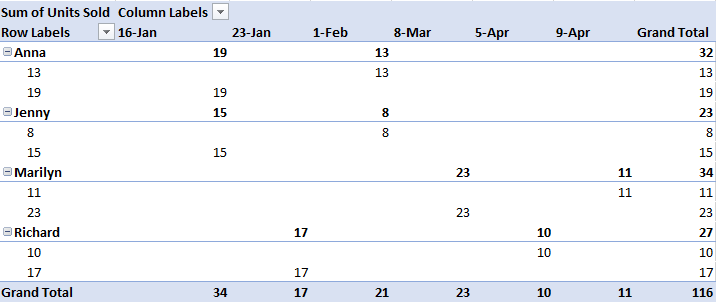
From the Pivot table above, we can now say that:
- Marilyn had the most sales, while Jenny had the least
- Jan 16 had the most sales, while April 5 had the least
This is just one example of the myriad of ways you can summarize data. You can ‘pivot’ the data by dragging the items around to show a different aspect of the data summary.
If you want to speed up your data preparation before working with Pivot Tables, you can check out Speed Up Your Excel Encoding With Flash Fill, which shows an easy way to automate repetitive patterns.
Have an office Excel problem that you’ve been wanting to solve? Contact us today for a customized solution specific to your business needs!
This article was first published at Rightjob Solutions, under the title:
Excel Tip – Understanding Pivot Tables
A reliable PivotTable workflow
- Convert the source range into a table or confirm that every column has one clear header.
- Remove blank rows, merged cells, and mixed data types that can distort the summary.
- Select a cell in the dataset and choose Insert > PivotTable.
- Place descriptive fields in Rows or Columns and measurable fields in Values.
- Review the value-field setting so totals use the intended calculation.
- Refresh the PivotTable whenever the underlying records change.
Microsoft’s current PivotTable instructions cover Excel for Microsoft 365 and recent desktop versions.
If spreadsheet reporting is consuming time that should go to customers or operations, explore Rightjob’s virtual assistance services.
FAQs
Why does my PivotTable show Count instead of Sum?
Excel commonly uses Count when a source column contains text, blanks, or numbers stored as text. Clean the source column, refresh the PivotTable, and confirm the value-field calculation.
Does a PivotTable update automatically?
Not always. Refresh it after changing the source data, and ensure the source range includes newly added records.
Can a PivotTable change the source data?
No. It summarizes the source; rearranging PivotTable fields does not rewrite the underlying records.