
As more and more people are working from home due largely to the advent of COVID, working with spreadsheets has become almost unavoidable. With trackers and reports starting to pile up, you’d likely be behind in your deliverables if you aren’t as excel savvy! Wouldn’t it be nice if there was a way to quickly summarize large amounts of data? That’s where Pivot tables come in.
A pivot table quickly summarizes contiguous data from a table, that you can tweak and ‘pivot’ to show you different aspects of the summary. To demonstrate its usefulness, here’s a simple example table:
| Sales Person | Units Sold | Date |
| Richard | 17 | 01-23-2022 |
| Jenny | 15 | 01-16-2022 |
| Marilyn | 23 | 03-08-2022 |
| Anna | 13 | 02-01-2022 |
| Richard | 10 | 04-05-2022 |
| Anna | 19 | 01-16-2022 |
| Marilyn | 11 | 04-09-2022 |
| Jenny | 8 | 02-01-2022 |
With trackers and reports starting to pile up, you’d likely be behind in your deliverables if you aren’t as excel savvy!
By using a pivot table to quickly summarize the table above, you can answer questions like:
- Who has the most sales in the entire period
- Who has the least sales in the entire period
- What date had the most sales
To create the pivot table to answer these questions, follow the steps below (for Office 365):
1. Highlight the entire table
2. Go to the Insert tab, then click PivotTable > From Table/Range
3. In the PivotTable Fields section, drag ‘Sales Person’ and ‘Units Sold’ respectively into Rows
4. Drag ‘Date’ into Columns
5. Finally, drag ‘Units Sold’ into Values.
You should get a Pivot table that looks like this:
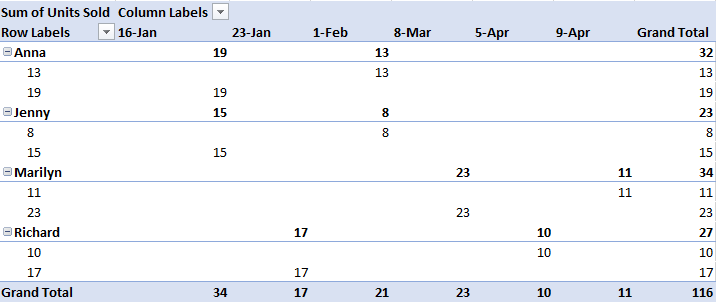
From the Pivot table above, we can now say that:
- Marilyn had the most sales, while Jenny had the least
- Jan 16 had the most sales, while April 5 had the least
This is just one example of the myriad of ways you can summarize data. You can ‘pivot’ the data by dragging the items around to show a different aspect of the data summary.
Have an office Excel problem that you’ve been wanting to solve? Contact us today for a customized solution specific to your business needs!
This article was first published at Rightjob Solutions, under the title:
Excel Tip – Understanding Pivot Tables